Modern data centers are rapidly evolving to support AI driven workloads. New-age infrastructure built around NVIDIA GPUs and DPUs is reshaping how east-west traffic flows, how fabrics scale, and how performance is monitored. These AI-enabled devices generate massive telemetry signals while also introducing new operational challenges, including bursty traffic patterns, latency sensitivity, and distributed processing across fabrics.
As a result, many engineering teams are exploring AI driven observability not just for visibility but also to assist with anomaly detection and intelligent remediation workflows. Instead of simply highlighting issues, modern observability platforms increasingly provide recommendations or automated responses that help stabilize EVPN based environments.
Understanding Network Observability – The Three Pillars
Network observability is often described through three complementary data sources: metrics, logs, and traces. Metrics provide a quantitative view of performance; logs capture events and system context, and traces help visualize how traffic moves through the fabric.
When these signals are analyzed together, operators gain a clearer understanding of behavior across AI enabled data center fabrics.
Figure 1 highlights how these pillars align to support deeper analysis and actionable intelligence.
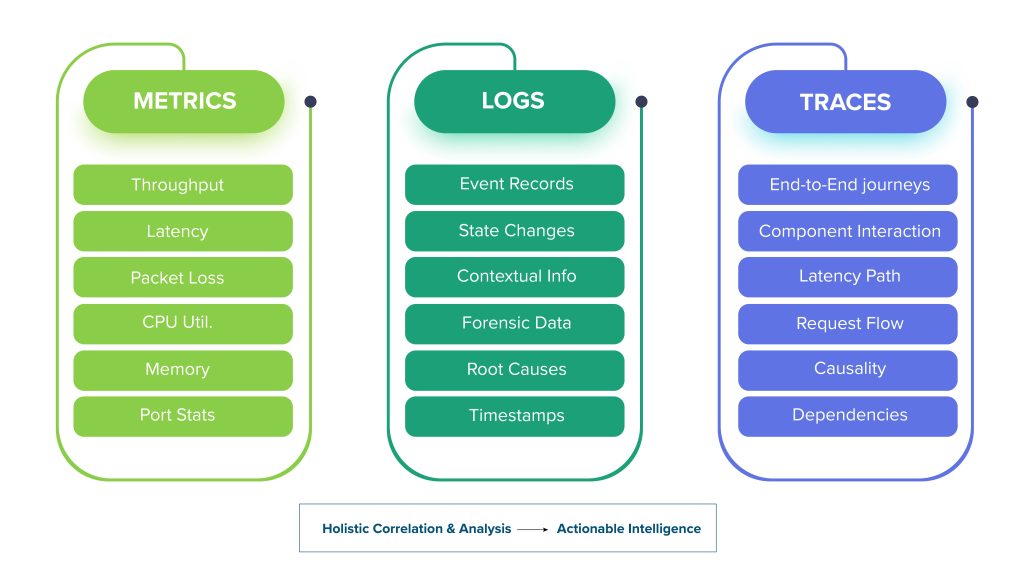
Figure 1 – Three Pillars of Network Observability
AI and Machine Learning in Network Observability
AI-powered analytics can go far beyond simple visualization. Using machine learning, the systems can detect anomalous behaviors such as unusual endpoint churn, abnormal GPU cluster traffic, or unexpected control-plane behavior. In the most highly automated setups, AI engines can trigger workflows, such as adjusting policies, rerouting traffic, or initiating remediation steps.
Rather than replacing operators, AI augments operational workflows by reducing noise and surfacing high-confidence insights that help teams respond faster.
Why EVPN is Well Suited for AI Observability
EVPN fabrics naturally produce rich telemetry, including BGP route updates, MAC/IP mobility information, and VXLAN statistics. When combined with AI enabled infrastructure such as GPU clusters or smart DPUs, this telemetry becomes even more valuable for understanding traffic patterns and workload behavior.
Figure 2 presents a simplified architecture that shows how EVPN telemetry flows into analytics platforms, which transform raw data into operational insights.
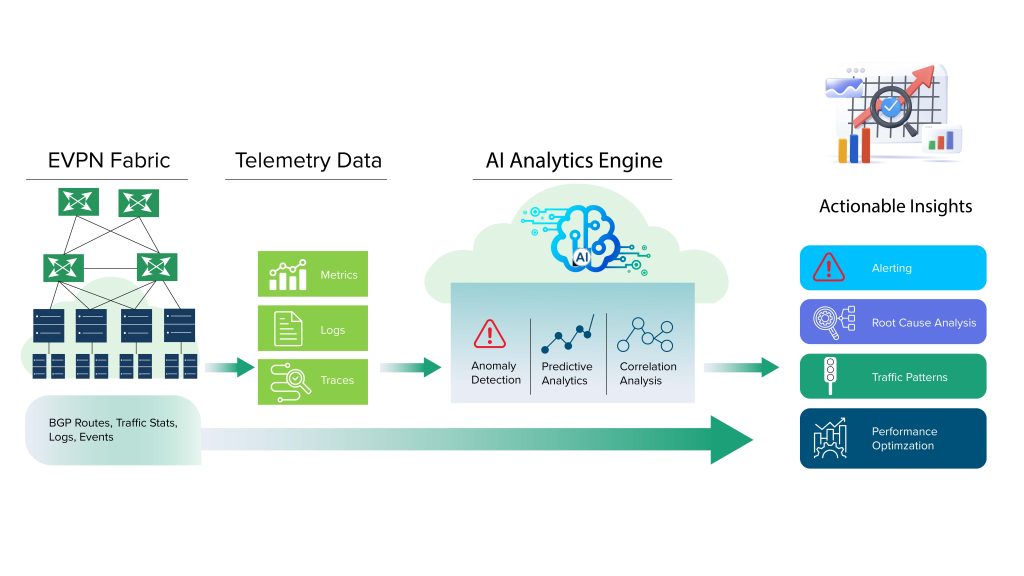
Figure 2 – High-Level AI Observability Architecture
Use Cases and Benefits
Common data center use cases include monitoring GPU-based AI training clusters, detecting abnormal traffic bursts between compute nodes, and correlating convergence events with application performance. AI-driven observability can assist in anomaly detection, predictive analysis, and guided remediation, helping teams maintain stability in highly dynamic environments. Organizations adopting AI-driven observability in EVPN environments often focus on practical operational outcomes, especially in data centers supporting GPU clusters and AI-intensive workloads:
Detecting anomalies such as abnormal endpoint churn, unexpected mobility patterns, or unusual traffic bursts between compute nodes
Monitoring BGP convergence behavior and overall fabric stability across dynamic AI fabrics
Forecasting traffic growth to support proactive capacity planning for east-west GPU and distributed workloads
Reducing troubleshooting time through automated even correlation and guided remediation workflows
These use cases help shift operations from reactive troubleshooting toward more proactive, data-driven optimization aligned with modern AI-enabled data center operations.
Vendor Solutions and Industry Ecosystem
Many observability platforms today are embedding AI with EVPN telemetry to enhance operations in modern data centers. For instance, the CISCO Nexus Dashboard Fabric Controller with Cyber ML delivers fabric-level analytics; CISCO ThousandEyes provides visibility into end-to-end paths, and CISCO Splunk services facilitate telemetry aggregation and behavioral analytics. Meanwhile, Juniper Paragon Automation, Arista CloudVision, Nokia Service Assurance, and Datadog also provide similar features around telemetry correlation, performance insights, and operational visibility.
Thanks to these AI-powered data center platforms, network telemetry and application performance can be correlated effortlessly, thus providing a comprehensive operational view of hybrid environments.
Final Thoughts
As AI workloads continue to reshape the data center design, observability becomes more than a monitoring function; it becomes a foundation for intelligent operations. Combining EVPN telemetry with AI driven analytics enables teams to move toward proactive anomaly detection, guided remediation, and improved operational confidence.
Starting with focused use cases and internally designed architectures helps organizations adopt these capabilities while maintaining originality and operational control.

is a Senior Test Architect at Happiest Minds, bringing extensive hands-on experience in manual and automation testing. His expertise lies in DATACOM-Networking, including layer 2 and layer 3 protocols and virtualization technologies. Additionally, he possesses proficiency in TELECOM, particularly in Mobile Packet Core GWs.
In his role, Deepak has led multiple feature releases across customer-facing product lines. He has actively contributed to the development of test automation frameworks and has played a key role in creating, enhancing, and troubleshooting test scripts. Over his 16-year career, he has collaborated with leading organizations in the networking domain, significantly strengthening his industry expertise.